
SwimAnalyzer User Guide
For coaches, swimmers and parents. No technical skills required: if you can film with an iPad and tap a big round button, you can use SwimAnalyzer.
Set a goal
The app instantly computes the ideal race: splits, speeds, stroke rates. That's the Race Model.
Film the race
Tap SPLIT at every marker. The app records the video and the times, in sync.
Overlay both
Wherever the real race departs from the model, you see it — and replay the video frame by frame.
SwimAnalyzer doesn't tell you whether the race was good. It tells you exactly where it was won or lost.
The equipment
An iPad
The app is built for the big screen: the tables and curves need room to breathe.
Landscape orientation
The whole app is locked to landscape. A message will remind you during video capture.
Camera permission
Requested the first time you open capture. Say yes — without it, only manual entry stays available.
An active subscription or trial
The app opens with a presentation, then the SwimAnalyzer Pro offer. The free trial unlocks everything.
Spot, before the race, the marks on the ground or the lane rope that correspond to 15 m, 25 m, 35 m and 45 m. Your thumbs will do the rest on their own.
The 4 tabs
Home
The logo and the tagline. A breather, not a work screen.
Swimmers
Your HQ. Everything starts here: create a swimmer, create a model, run an analysis, compare two races.
Modeling
The simulator: "what if I aimed for 26.00 instead of 26.50?". You play with numbers without saving anything.
Settings
Subscription, light/dark theme, language, video storage, privacy.
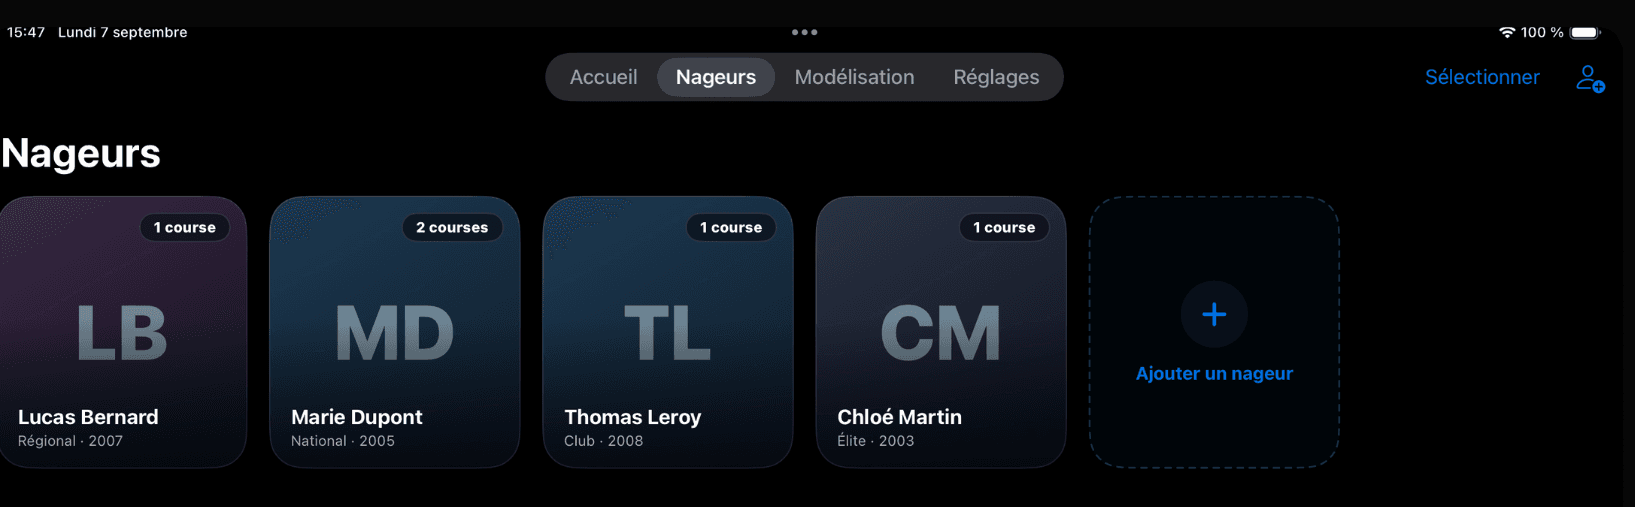
Understanding the hierarchy — always the same nested structure
A swimmer can have as many models as you like. Each model holds one analyzed race.
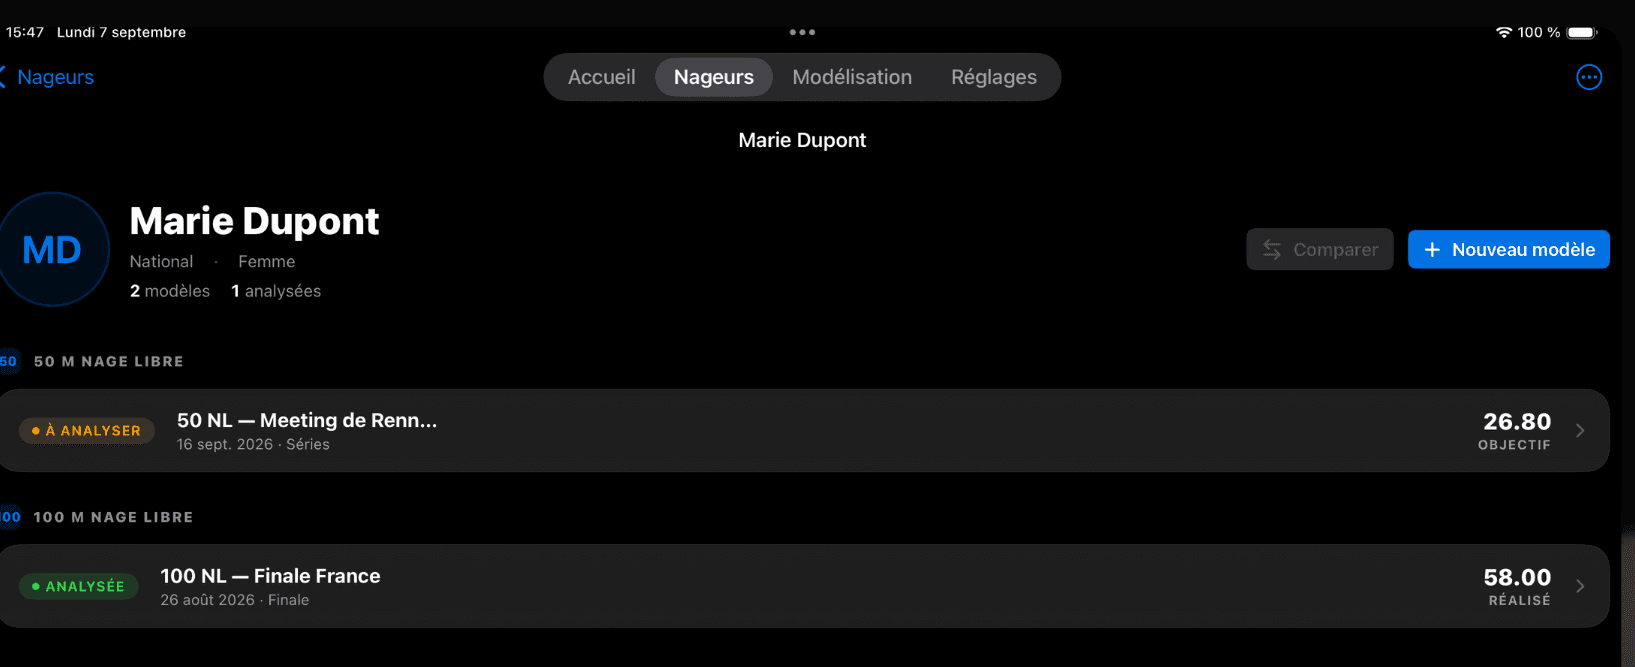
Your first 15 minutes
Five steps, worth understanding once — after that it becomes a reflex.
Create a swimmer
Swimmers tab → Add button. Only the first name is truly required. Last name, photo, level, sex, date of birth and notes stay optional.
Archive (long-press a card) puts a swimmer away without losing anything. Delete permanently erases the swimmer, all their models and all their races.
Create a Race Model
Three decisions, no more: the goal time, the stroke and the distance. Time entry uses the same reflex everywhere: the "calculator keypad".
Try the calculator keypad
Type 2 6 5 0 to get 0:26.50
No comma to hunt for, no colon to place. You type, it lands right. As soon as the time is plausible, the app shows the m/s and the pace in s/100m — an excellent detector of an unrealistic goal.
Read the model
The richest screen in the app. A status badge sums up the situation:
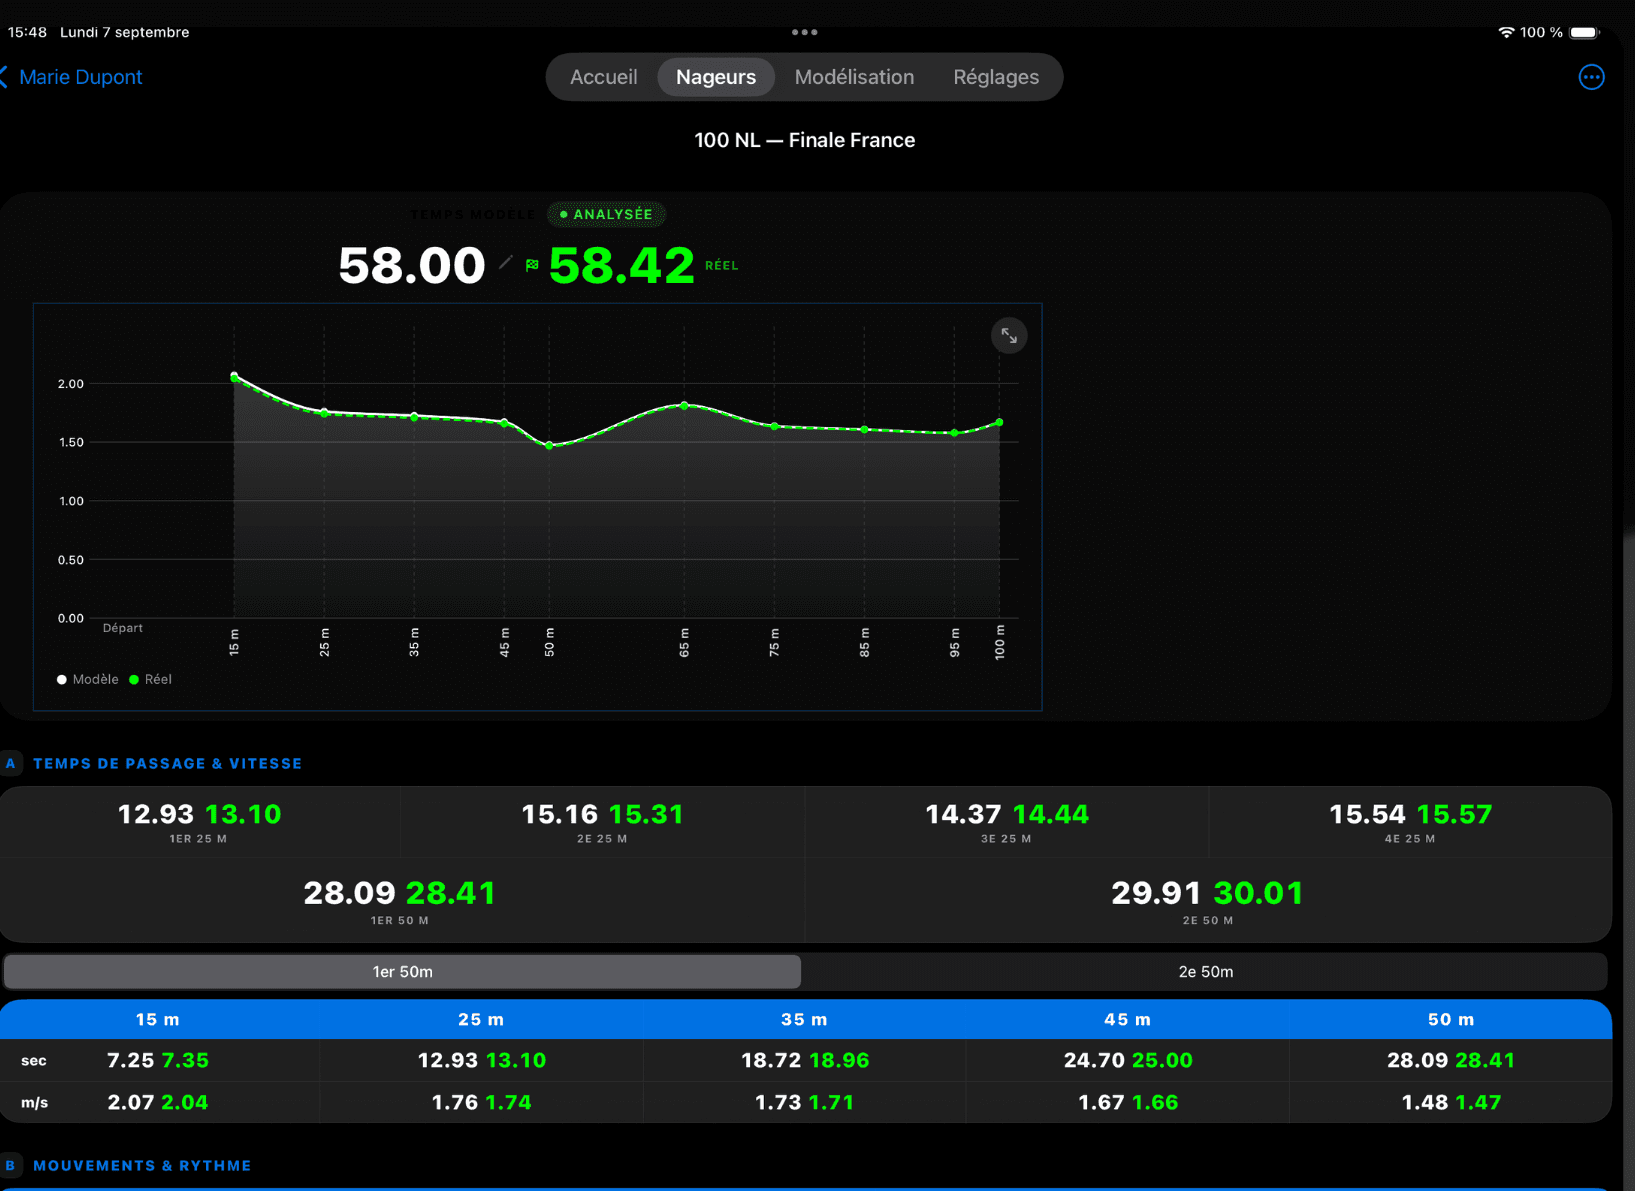
The big goal time is editable with one tap: tap it, and everything recalculates — splits, speeds, stroke rates, curve. It's the best tool for a conversation with a swimmer.
Block A — Time & Speed
Splits by section, then the marker table (cumulative time + speed). Dark figure = model, green figure = real race.
Block B — Stroke & Rhythm
Stroke rate, stroke count, tempo, distance per stroke. Two swimmers can hit the same time in opposite ways — this block says which.
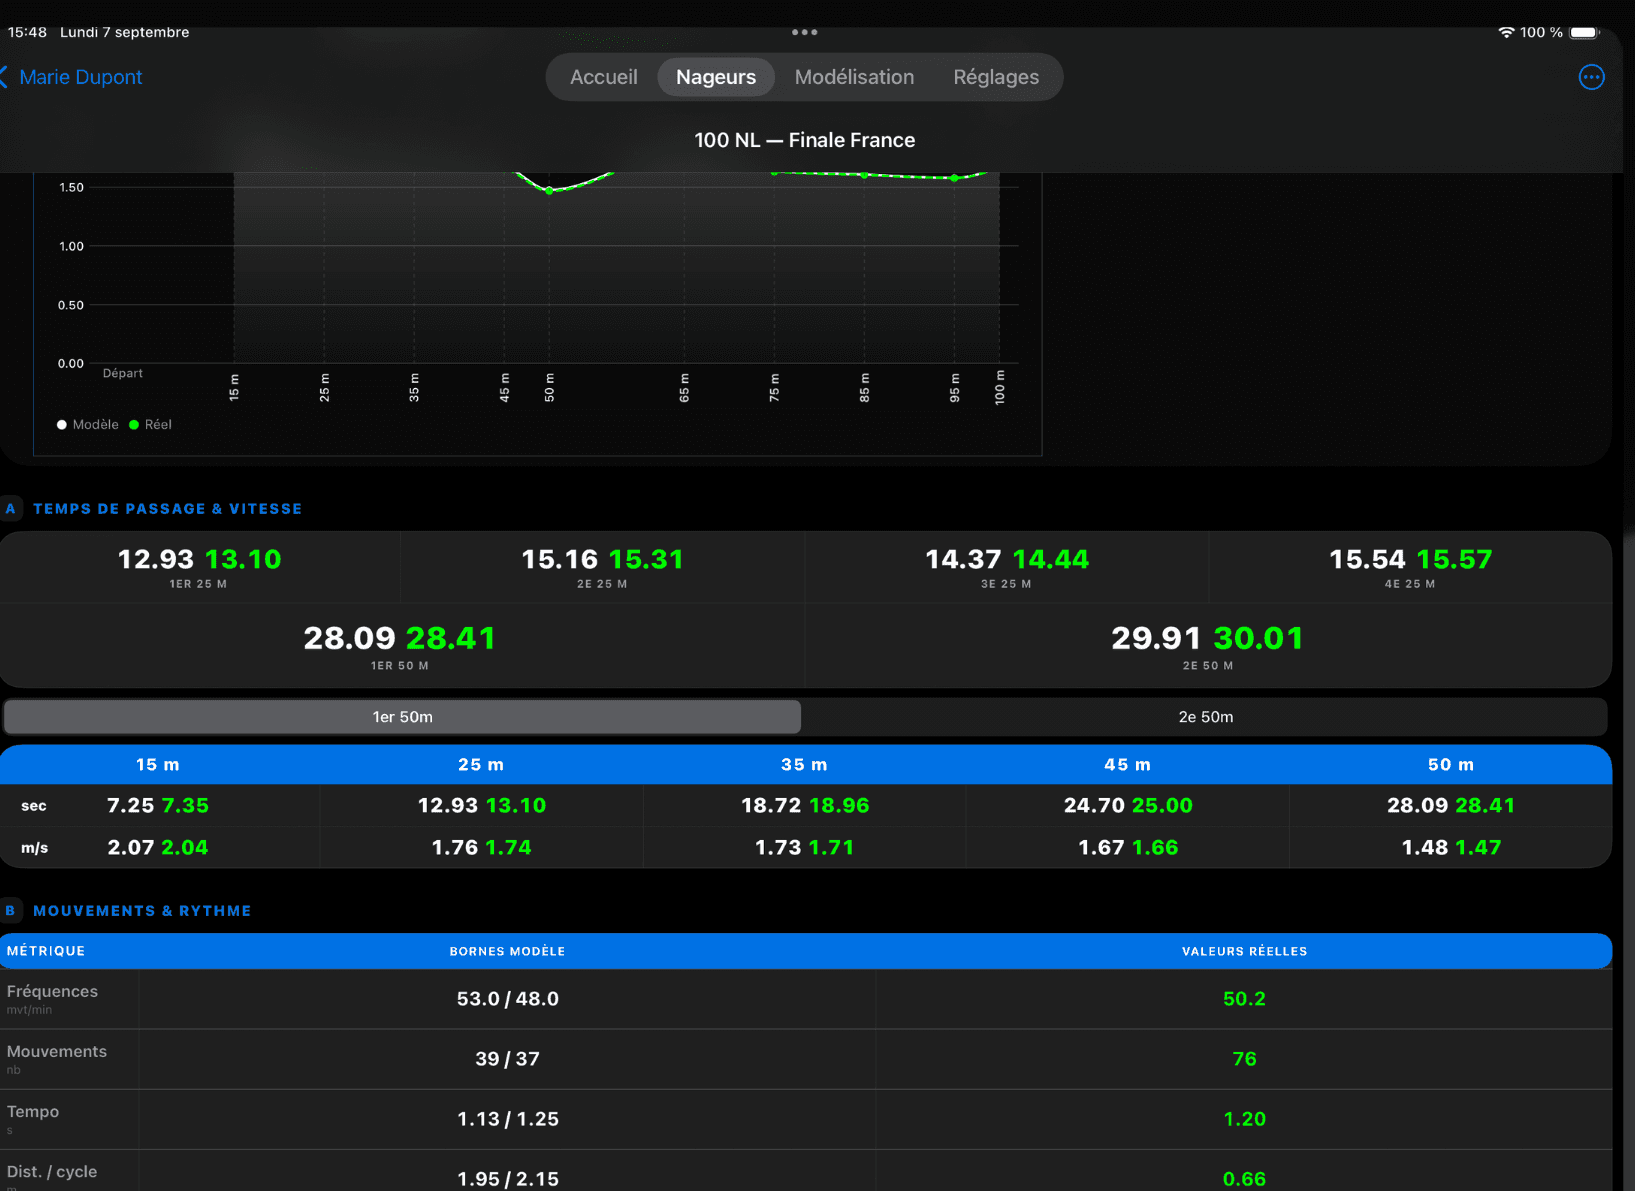
Full definitions in the glossary.
Analyze a race
Live video
You're poolside, the race is about to start. You get the times and the synced video, ready less than a minute after the finish.
Manual entry
You have the times from a stopwatch or a meet result sheet. Same analysis, without an associated video.
Either way, stroke metrics stay optional: time analysis works without them.
Read the results
- The total time
- The gap vs the model — green if ahead, red if behind
- The speed curve, actual vs model
- The length-by-length breakdown, tinted by the gap
- The video, with clickable markers on the scrubber
Close this screen: the race now lives on the Race Model sheet, overlaid on the model.
Video capture, step by step
The most athletic moment of the app. The app doesn't measure lengths, it measures fixed distance markers — finer-grained, and it captures the start and the finish, where it all happens.
| Distance | Markers to capture | Taps |
|---|---|---|
| 50 m | 15 – 25 – 35 – 45 – 50 | 5 |
| 100 m | 15 – 25 – 35 – 45 – 50 – 65 – 75 – 85 – 95 – 100 | 10 |
| 200 m | 15 – 25 – 50 – 75 – 100 – 125 – 150 – 175 – 200 | 9 |
No need to memorize this table: a "NEXT MARKER" banner permanently announces the next one.
Simulate a capture (50 m)
Click START, then tap the button at every announced marker: 15, 25, 35, 45, 50 m. The last tap stops everything automatically.
A bit early or late
The "Undo last" button stays available for 5 seconds after every tap. One tap, and you try again.
Reflex double-tap
Less than 2s apart: the app asks "Delete the last captured time?". No duplicate gets through.
Race to redo
Cancel button, top right. Nothing gets saved, neither video nor times.
Always tap at the same point on the body — the head crossing the mark, for instance. An imperfect but consistent convention beats random precision.
Landscape, always. Once recording has started, the app ignores rotation: an accidental tilt won't cut your capture.
Manual entry
No camera, no problem. One box per distance marker: you type the cumulative time since the start (always the calculator keypad), and the app shows the model's time at the same marker in grey. You see the gap as you type.
The "Validate analysis" button only activates once every marker is filled in and consistent. The Stroke & rhythm section stays optional: leave it blank if you didn't count.
Refine, correct, complete
Once a race is recorded, every split time stays editable by hand. You never need to redo a capture to fix an approximate tap.
Correct a time by hand
In Block A, tap a green time (the real one). The number pad opens, you correct it, everything recalculates.
Re-anchor a marker on the video, frame by frame
The app's most precise feature. Open the video full screen, tap the badge for the marker to fix, step frame by frame (0.5× to fine-tune), then "Validate this frame". The whole analysis updates.
Fill in stroke data afterwards
In Block B, tap a dash and enter what you counted on video. The linked metrics derive automatically.
Compare two races
Requirement: you need at least two analyzed races on the same event (same distance, same stroke). Otherwise the button stays greyed out — that's normal.
The reflex to adopt: create one Race Model per race (for example "50 FR Heats" and "50 FR Final"). Each model hosts one race; that's what makes comparison possible.
Splits at every level, stroke metrics side by side, and a section selector to zoom into the 1st or 2nd 50 m.
The simulator
Modeling tab. Here, nothing is saved until you decide to.
Pick a time, a stroke, a distance — every block recalculates live. It's the tool for season-opening meetings and poolside conversations:
"To reach that time, you'll need to hit the 50 m in 27.4 and hold 2.05 m per stroke cycle. Are we there yet?"
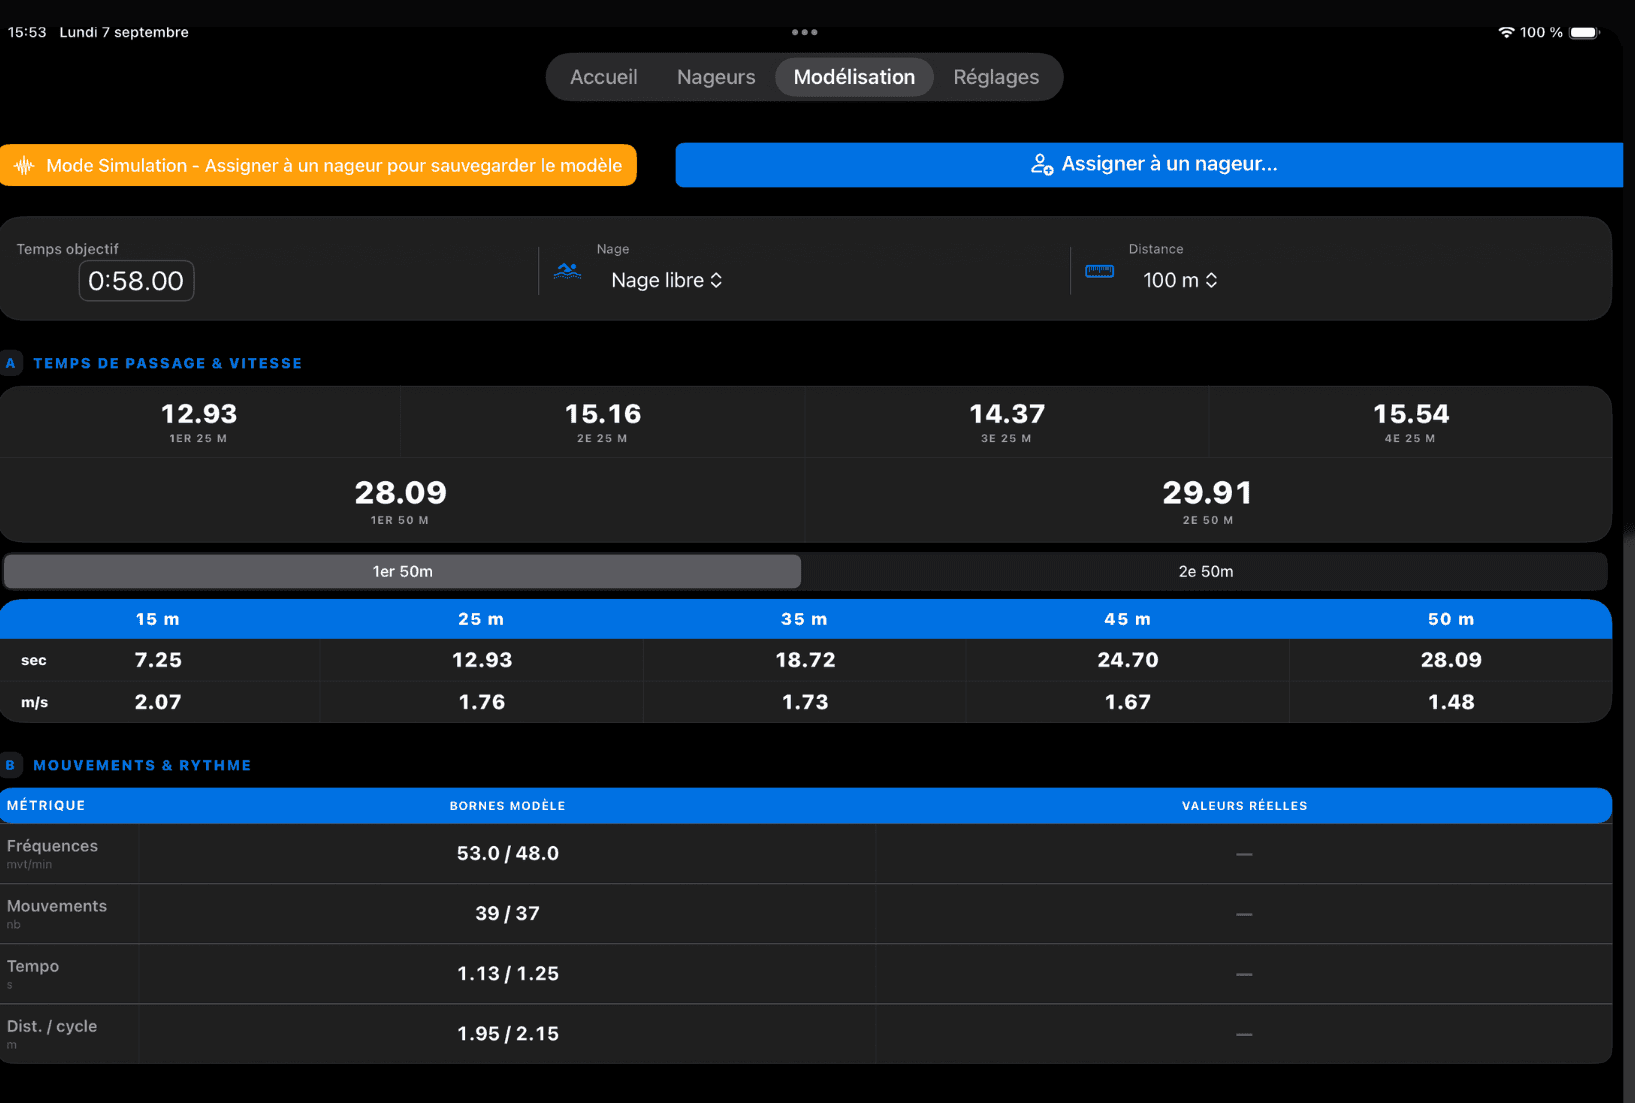
Assign to a swimmer… — the model gets saved to their profile, ready to be analyzed.
The useful glossary
Split time
The elapsed time since the start at a given marker.
How the race is built.
Split
The time taken for one section (a 25 m, a 50 m…).
Where it speeds up, where it slows down.
Speed (m/s)
Metres covered per second on a section.
The universal language of comparison.
Pace (s/100m)
The time scaled to 100 m.
Translates a goal into the unit every swimmer thinks in.
Stroke rate (spm)
The number of strokes per minute.
The arm rhythm.
Tempo (s)
The duration of one stroke cycle (60 ÷ stroke rate).
The same info as stroke rate, at the swimmer's own scale.
Distance / stroke
The metres covered per stroke cycle.
Pure efficiency.
Gap / Δ
The difference between the actual and the reference.
Negative or green = ahead. Positive or red = behind.
SWOLF
One length's time + stroke count.
An overall efficiency score: the lower, the better.
Race Model
The theoretical race plan computed for your goal time.
The reference everything is measured against.
Where do the model's numbers come from? From a coefficient table built into the app, broken down by stroke, distance and time bracket. The calculation is 100% local and instant — no connection required. All 12 combinations (50/100/200 m × 4 strokes) are covered.
Reading your race in 60 seconds
You don't need to understand the whole app to get something out of your results. Three questions, three places to look.
"Did I hit the time?"
The big banner at the top of the sheet. Dark figure = goal, green figure = your actual time.
"Where did it happen?"
The splits in Block A. The biggest gap between the dark figure and the green one is your work topic for the week.
"Why?"
The speed curve, then Block B. A curve that collapses while the stroke rate climbs: you're turning your arms over faster and moving less.
Slow-motion mode. In the video, slow-motion playback plus the pass markers is the app's best teaching tool. You see yourself fall off pace. And seeing it beats ten explanations.
Settings
Subscription
Trial in progress, active offer, change offer, restore purchase after switching iPads.
Appearance
Light / dark theme. Dark is the default: poolside, it's easier on the eyes.
Language
The app follows iPadOS's language. A button takes you straight to system settings.
Storage & videos
"Clear videos" frees up space while keeping all your analysis data.
Privacy
Privacy policy, legal notice, and "Delete my data".
Engine & about
The calculation coefficients' version and the app's version.
Where's my data? On your iPad. Videos, profiles, times: everything is stored locally. Nothing goes to a server.
Videos are large. A good routine: analyze, fine-tune your markers, export via "Open in Files", then clear. Your analyses stay intact.
Common issues
Cheat sheet
The full journey, in one line
Swimmers → Add a swimmer → New model → Analyze → Live video or Manual entry → read blocks A and B.
The 5 reflexes
- Times are typed without punctuation: 2140 → 21.40.
- START, then one SPLIT per marker — the last tap is a STOP.
- Fat-fingered it? Undo last within 5 seconds.
- Green = real, dark = model. Negative or green = ahead.
- One race = one model. That's what makes comparison possible.
3 hidden gestures that save time
- Tap the big goal time: everything recalculates live.
- Long-press a swimmer card: archive or delete.
- Tap a point on the speed curve: its exact value appears.